Waxed-Paper Photo-Meteographic Recordings from the Radcliffe Observatory
Sunday, April 1st, 2012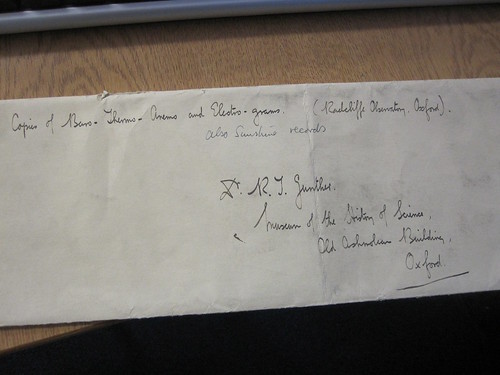
These baro-, thermo-, anemo-, and electrograms were recorded using meteorological instruments at the Radcliffe Observatory (currently, the main building of Green Templeton College) from 1861-1874. They were recorded on waxed-paper using a method developed by William Crookes in 1854 when he was a meteorological assistant at the observatory (1854-1856). Crookes was particularly interested in how the new technology of photography could be applied to scientific endeavors.
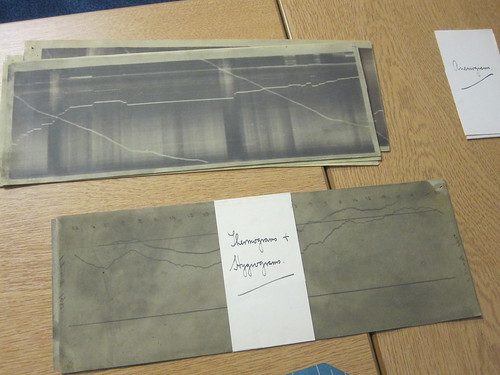
Though there are few traces left on these images to tell us how to interpret them correctly, we know based on their packaging to which meteorological phenomenon each of the images relates. The different waxed-paper recordings are stored in envelops that are labeled with the type of “gram” they contain. As examples, here (top image) is an example of an electrogram:
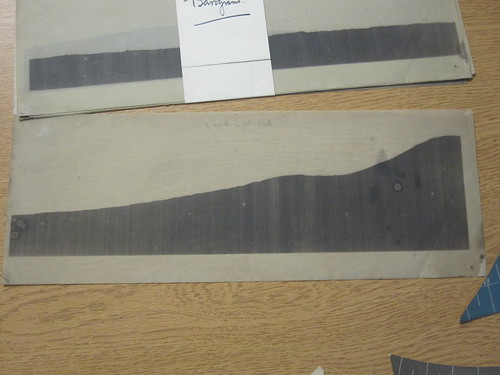
And here is an example of a barogram:
 .
.
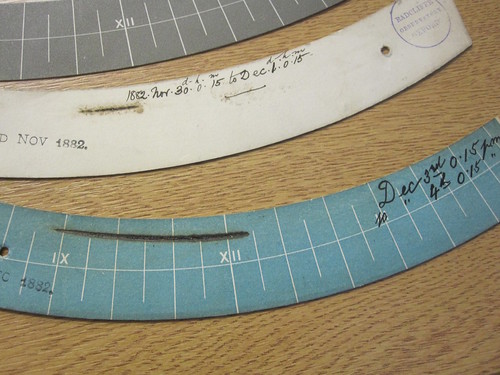
The file also contains “sun-recordings” which trace the intensity of the sun on certain days, by positioning a cardboard cutting with markings and having the sun burn through it over the course of the day. Here, is one such example:
We find these traces particularly haunting because they record something so transient: the daily weather. No two days are exactly the same, and it is difficult for us to retrospectively determine with any sort of accuracy past weather on a specific day. Though these objects are not entirely useful since we are lacking the knowledge necessary to read them properly, we do have a vague understanding of what they are trying to convey due to the markings on the images themselves and the envelopes that contain them. Using these waxed-paper photo-meteographic recordings (and sun-recordings), we can get a glimpse into Oxford’s very own forecast of over a century ago!