Blessed Plot
MS. Eng. b. 2056 (B. 281). The Bodleian Libraries, The University of Oxford.
Georgina Ferry is an Oxford-based science writer, and author of Dorothy Crowfoot Hodgkin: A Life (Granta 1998, reissued by Bloomsbury Reader 2014). In this guest blog post she discusses Dorothy Crowfoot Hodgkin’s work, the complicated process of drawing 3D structures as 2D figures and a computer programme called Pluto.
**
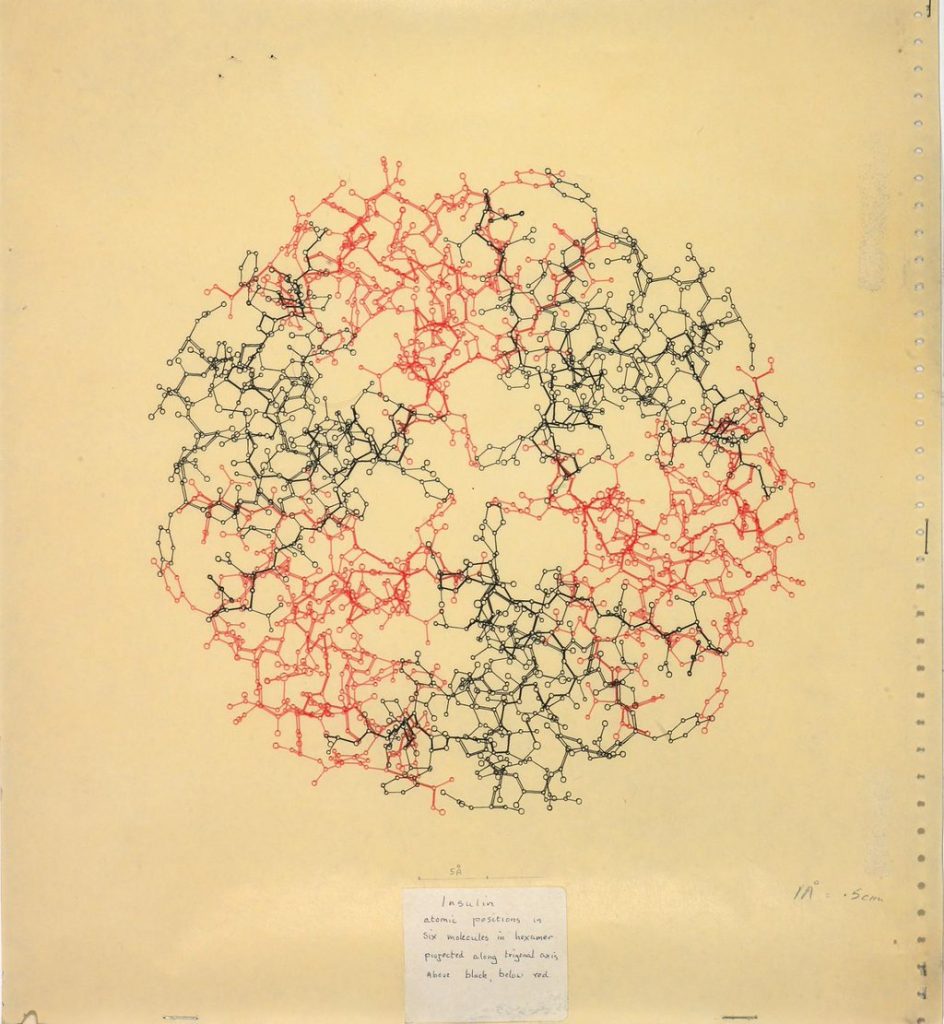
In 2015 the Bodleian Library included in its Marks of Genius exhibition a diagram of the molecular structure of insulin. The drawing, in red and black, came from the papers of the Nobel-prizewinning crystallographer Dorothy Crowfoot Hodgkin, who was also the first to find the structure of penicillin. The curators included it among examples of handwritten and hand-drawn works, as expressing the ‘creative intensity and singular character’ of their creators: a reproduction of it is also included in Back from the Dead. But did Hodgkin draw this picture?
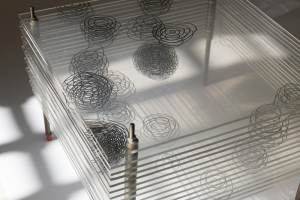
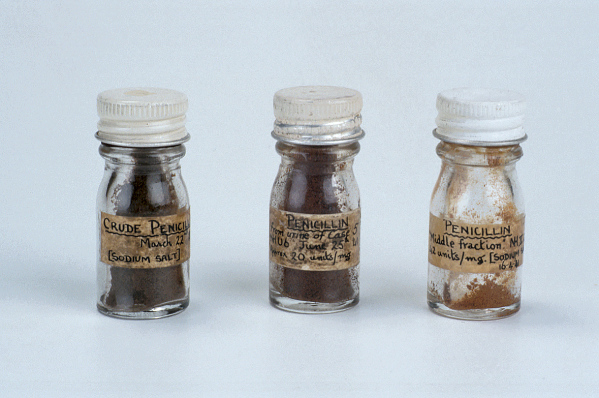
Model of the Structure of Penicillin by Dorothy Crowfoot Hodgkin on display in Back from the Dead.
X-ray crystallography reveals the spatial arrangement of the atoms inside crystals in three dimensions, and representing this structure in two dimensions for publication remains a challenge today. Hodgkin was a highly competent draughtswoman, the evidence going all the way back to the beautiful architectural paintings she made as an eighteen-year-old in her gap year. However, drawing structures was time-consuming work, and once Hodgkin had assistants working with her, the task was usually delegated to them. She even drafted in her sister Betty Crowfoot, who made the electron density maps of penicillin at different depths through the molecule that were used to construct the innovative Perspex model now on display as part of Back from the Dead.
So it was unlikely that Hodgkin would have drawn the insulin diagram herself. There was a clue in the Marks of Genius exhibit, however, that it was not drawn by human hand at all. The diagram was on tractor-feed paper, with tell-tale sprocket holes down either side. This kind of paper would have been used with the earliest plotters and printers. Intrigued, I contacted Eleanor Dodson FRS, Professor Emerita at the University of York, who was one of the team working on insulin and in charge of crystallographic computing for Hodgkin’s lab.
Professor Dodson told me that the diagram was indeed one of the earliest examples of the use of a computer program called Pluto to draw a protein structure with a pen plotter. The program was originally written by Sam Motherwell in Cambridge, brought to Oxford by his colleague Neil Isaacs, and modified by Dodson to make it suitable for proteins.
I rang up Dr Motherwell to find out more. ‘I first had access to a pen plotter in 1968’, he says. ‘Before that they were very expensive, and even in 1968 it was a very special resource that had to be shared with lots of people.’ The principle by which the plotter worked was very simple. ‘You had an X and a Y axis’, he says. ‘The basic set of instructions is nothing more than move the pen to point XY, pen up or pen down, move to the next point, and then you’ve drawn a line. If you wanted to draw a circle, you might need 100 little steps.’ Motherwell wrote the Pluto program in 1969 (the name was a contraction of Plot Utility – he was thinking of Walt Disney’s Pluto, not the planet). The critical thing he did was to make it easy for the user to input the coordinates. ‘That’s why Pluto became so popular’, he says. ‘Any scientist could use it.’
Dodson did not have access to a plotter until about 1971. The solution to the insulin structure was published in 1969, so all the first insulin drawings would indeed have been made by hand, though probably not Hodgkin’s (various technicians are acknowledged in her papers for drawing diagrams). ‘I had to make Pluto able to deal with many more atoms’, says Dodson, ‘and draw the correct bonds between pairs of atoms. For small molecules you just give a list of the coordinates, C1, C2, N1, O1 etc. But for proteins there is a very strict naming convention – I think we were using the names of the amino acids to say where to join the bonds. I remember it was a dreadful headache! But once we had it we used it a lot.’
The plotter was far too valuable for the scientists to have one of their own. Dodson had to write the programs and submit them to the Computing Service, whose staff would run the job. ‘It was incredibly slow’, she says. ‘That insulin image probably took an hour to print. And if the computer service people got something wrong, that was irritating. It was quite a thing to draw a picture like that – you wouldn’t do it every day.’
Although Hodgkin did not concern herself with the details of the programming, she was extremely interested in the results. ‘She had a very good 3-D sense’, says Dodson, ‘and loved looking at electron density. She put a lot of thought into how you best illustrate structural stuff. Even with modern computer graphics, it’s still a problem, how you produce a two-dimensional figure for publications. There are a lot of conventions about what colours you use to make it easier to visualise what is happening.’
When I told the curators of Back from the Dead this story, they were able to change the description of the insulin illustration to read ‘plot’ rather than ‘drawing’. I’m rather sorry to see that the image is not included in the online Marks of Genius exhibition. While it may not have been drawn in Hodgkin’s own hand, it illustrates something much more interesting: her collaboration with colleagues within and beyond Oxford to marry imagination and technology in visualising the invisible.